Author
Adam Sharp, Services Delivery Director
I was recently invited by Transport for NSW to run a workshop about data analytics, machine learning and future technological developments to subject matter experts across Transport Signalling and Communications.
The reality is that what I shared is relevant to anyone in the transport industry, from asset managers to operations to transport business leaders. Actually, I’d go a step further and say what I share is industry agnostic. Data analytics is relevant to anyone who ultimately makes decisions, be it in ESG, Sustainability, Agriculture, or Enterprise. You get my point.
I say this, as data is at the core of good decision making. Decisions that result in operational efficiencies, cost savings, improved customer experience, and the ability to meet contractual obligations.
So today I share with you the content I shared with Transport for NSW. I’ll cover my responses to the following questions. By all means feel free to jump to the question that you’re most interested in.
If you want to dig deeper into your transport data challenges, or what the use cases for predictive analytics might look like for your business, contact me here, or book a chat with our transport analytics team. I live and breathe all things transport data, and want to help Australia become the most data-driven transport country in the world!
Data & Analytics Questions I Answer:
- 1. What are some of the data challenges faced in the Australian transport industry that Toustone is trying to solve?
- 2. How does data analytics integrate and process diverse data sources to benefit organisations?
- 3. Once you have data storytelling, what can transport operators do with those insights?
- 4. How can data analytics transform organisational performance?
- 5. How have you witnessed tangible business benefits from data analytics in practice?
- 6. What types of analytics have proven most effective in driving business decisions?
- 7. How is real-time data leveraged in the rail industry for operational efficiency?
- 8. How do you utilise traditional data types for operational insights?
- 9. What are AI and Machine Learning, and how do they differ?
- 10. How is machine learning applied in transport for predictive maintenance and sustainability?
- 11. What is the accuracy of these predictions?
- 12. You touched on using machine learning in the asset management world for improved preventative maintenance, can you explain this further?
- 13. How does real-time data enhance machine learning algorithms?
- 14. What are some other emerging data technologies that you are using to gain further organisational insights?
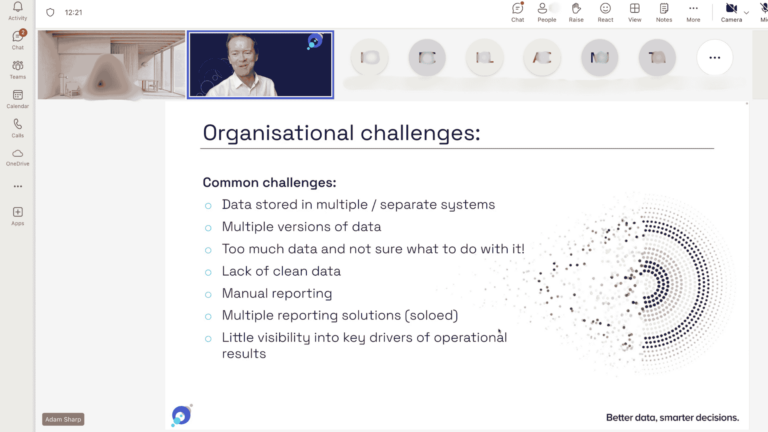
1. What are some of the data challenges faced in the transport industry that Toustone is trying to solve?
At the very core I’d say it’s about reducing data silos and extracting value from your data, what I mean by that is having such deep trust in your data that you then feel confident to make decisions based on it.
It all starts with ensuring that we help the organisation gain streamlined access to its data, which is often scattered across multiple systems and locations. For instance, data might reside in asset management systems, finance systems, scheduling platforms, train management databases, customer records, and even weather data repositories, all spread throughout the organisation.
In some cases, there are multiple versions of the same data.
Often, we hear from clients that there is just too much data to manage, and they don’t know where to start or how to process it. There are also issues with data cleanliness and accuracy, which inevitably lead to what is commonly referred to as ‘manual reporting Excel hell.’ This situation results in everyone having their own versions of the same analysis, spending far too much time creating reports instead of actually analysing the information and acting on it.
Even worse, there are reporting solutions across every different tool or system being used.
In isolation, these siloed reporting solutions ultimately lead to a lack of visibility of key information and insights across the business.
This lack of integration and cohesive data management is a key issue that we aim to address, ensuring that organisations can access, clean, and utilise their data effectively to drive better decision-making and outcomes.
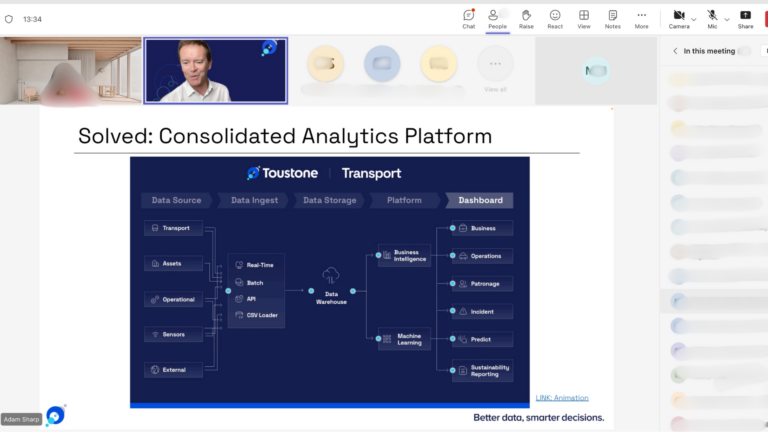
2. How does data analytics integrate and process diverse data sources to benefit organisations?
Data analytics involves gathering and consolidating data from various sources within an organisation, which more often than not are siloed when we encounter them. It often includes internal and external systems, cloud-based systems, vendor solutions, spreadsheets, manual data files, and so on.
Once these disparate data sources are integrated into a unified platform, the data is processed and analysed. This centralisation allows us to perform a range of analyses with confidence that the data represents a single source of truth for the organisation. This includes traditional business intelligence tasks such as creating dashboards and reports, as well as more advanced analyses like machine learning.
The insights generated from this analysis are tailored to the organisation’s specific business requirements. It is rather bespoke, as I am yet to come across two organisations who are reporting on the exact same thing. Common output I have observed in the transport sector common outputs in the transport sector often include key performance indicators (KPIs) such as operational metrics, performance against regulatory requirements, patronage data, and usage statistics. These insights help organisations make informed decisions, improve operational efficiency, and meet strategic goals.
For instance, in the signalling and communications sector of the transport industry, typical analyses might focus on incidents, their causes, and impacts. We increasingly use predictive analytics to anticipate future events, understand potential outcomes, and determine actions to address those predictions. We’re also seeing ESG and sustainability considerations, particularly regarding carbon emissions and environmental impacts, are also becoming more prominent.
Overall, we aim to solve the business issues we’ve mentioned earlier: disparate data sets, inaccuracy, and processing them through a single platform for consolidated and integrated business information analysis.
By going through this process, we can elicit a single version of a metric or insight. It unites the organisation as everyone can understand delivered services against the timetable from a trusted, accurate source.
Automation plays a key role here, reducing manual report creation and shifting focus to analysis. With data ingested on a daily or real-time basis, organisations can leverage opportunities such as data storytelling to further enhance decision-making.
3. Once you have data storytelling, what do you do with those insights?
Once we have that information, we can begin to interpret it within the context of our organisation to elicit understanding and communicate that information back into the business.
Because we’ve gone through all of that foundational data work, we now have the opportunity to take those insights and start communicating them across the organisation.
Furthermore, we can make use of far more sophisticated levels of information analysis through technologies like AI and machine learning.
4. How can data analytics transform organisational performance?
The opinions are endless. I mean that. I have been working with data for decades and with many organisation across a myriad of industries, and what they have been able to achieve to improve their performance, using data, is honestly impressive.
In the transport sector, for instance, we see notable enhancements in productivity and significantly faster reporting and analysis. By shifting focus from merely creating spreadsheets to analysing results, transport organisations can act on insights sooner, rather than being reactive after issues have already occurred. Real-time insights are a key advantage here, enabling proactive decision-making and timely interventions.
Another critical benefit is organisational alignment.
When everyone operates from a single, accurate source of truth, it ensures that all stakeholders have the same information and are on the same page.
This unified approach not only eliminates discrepancies but also frees up time previously spent on manual reporting and communication, allowing teams to advance to more sophisticated stages of data analytics, such as predictive analytics.
Predictive analytics opens up new possibilities by forecasting opportunities and outcomes with greater reliability. This foresight can lead to strategic advantages and improved decision-making, driving further value for the business. For example, data and machine learning allow us to be able to predict where things will go wrong in transport operations, with assets or even energy consumption, and address them before they do.
Moreover, the move towards enhanced accuracy and quality in data processing is crucial. By continuously checking and improving data quality, organisations can ensure that their insights and forecasts are based on reliable, accurate, and complete data.
This ongoing commitment to data quality helps avoid the pitfalls of “garbage in, garbage out” and supports more accurate forecasting and better business decisions.
In summary, the transformative impact of data analytics in the transport sector is evident in improved productivity, real-time insights, organisational alignment, and enhanced data quality. I have said it before, and I’ll say it again, but as organisations embrace these advancements, and say goodbye to siloed data and manual reporting for good, they unlock new opportunities for growth and efficiency.
5. How have you witnessed tangible business benefits from data analytics in practice?
A good example of how we’ve been able to see these sorts of business benefits realised is with one of our clients, a major Australian rail operator. They’ve gone from generating reports, taking three to four hours every morning, down to just 16 minutes. Now, that 16 minutes is typically spent going through all those pre-populated dashboards and reports to extract the key information they want to then communicate across the business.
So, that is in fact 16 minutes of analysing, not creating, from which they can then actually start to communicate and start making decisions and actions that are done well and truly by the start of business each day.
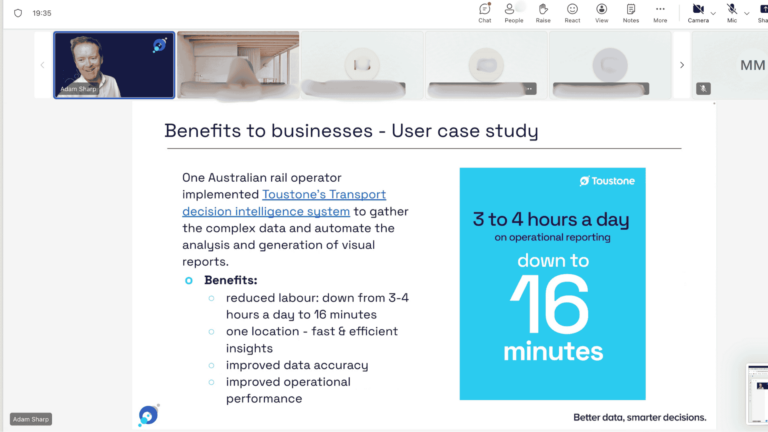
I did the maths on this last year, if the the average number of work days per year in Australia is 249, our transport operator client went from 747-996 hours spent ‘creating’ reports down to 66.4 hours per year. They could then better use this time to analyse the insights and generate key business information.
Now let’s let that sink in.
So, this is a very tangible example of the business benefit around speed to insight.
But it isn’t only about time saved, it’s also been identified that the accuracy and the quality of the automated insights we create as opposed to the previous manual process are far superior.
6. What types of analytics have proven most effective in driving business decisions?
I’m going to touch on a couple of different types of data. Let’s start with real-time data. This is all about giving you the ability to make decisions based on what’s happening now and that then gives you the ability to minimise any issues that are occurring now before you lose the opportunity to do so.
But the inverse of that is also true.
If there is an opportunity to capitalise on a positive situation, you can capitalise on that now before that opportunity disappears.
A good example of this in the retail space would be seeing customer behaviour in real-time. So for example, in a supermarket situation where you’re having a run on a product or a run on a particular service, you can divert resources there immediately to ensure that the customer service is maintained without impacting customer quality and so on.
Another important aspect, though more conventional, is traditional reporting. This is where it gives us the ability to reflect on and see what the business operations are today and how we’re performing relative to targets, how we’re trending versus our historical opportunities that may be emerging that we need to understand.
We can talk to the fact that this is an organisation-wide view of the motion and the ability to look at metrics and information at a high level and start to drill in and dive into the details to understand what’s driving that.
This is an important thing around understanding where we focus our attention, and if you like, if we need to improve metrics and performances.
7. How is real-time data leveraged in the rail industry for operational efficiency?
Looking at a report rendering, an example of raw data streamed into our transport suite platform is train event data. If you glance at the event messages, you’ll find details such as train departures from specific locations, platform activities, weight values, and door closures. These are all disparate events streaming into the platform, illustrating how the data is continuously flowing in.
We then ingest this data and proceed to process it, presenting various metrics and reports. Taking the real-time example first, we have an actual live map of metro trains, showing their positions approximately 7 to 10 seconds ago.
This data is genuinely live, streaming from the trains to the platform. We can pinpoint a train’s location, its speed at the time, and its ID. This data updates with every movement.
Moreover, we can overlay additional information, such as Google Maps traffic data. For example, if roads are green, this indicates smooth traffic flow. However, once red, this feature proves invaluable during incidents, enabling us to redirect buses or other services based on real-time traffic insights. This exemplifies using data in real-time to inform decision-making.
We can also track our journeys relative to the schedule. This visibility is crucial at senior management levels, providing insights into operations without the need to contact the operations room for updates. It also aids incident management by pinpointing issues, their duration, and locations.
You have to see it to truly understand it, so ping me if you want me to show it to you.
8. How do you utilise traditional data types for operational insights?
We leverage traditional data types through our operations dashboards to gain valuable operational insights. These dashboards present key metrics that measure various aspects of our delivered services, such as the number of services against the schedule, headways, and journey times. We also track sectional running times between stations throughout the day, segmenting this data by different service periods.
Each metric on the dashboard is configured to trigger alerts when predefined thresholds are met.
This process starts with raw data, which we continuously ingest and process. By integrating and analysing this data, we generate detailed insights and reports.
For example, when assessing delivered services, we can drill down from high-level metrics to detailed analyses. We examine daily deliveries over specific periods, like the current month, and compare them against scheduled services. This detailed analysis allows us to calculate the percentage of services delivered and identify the factors influencing this metric.
In essence, traditional data types are used to build a comprehensive view of operational performance, enabling us to monitor key metrics, detect anomalies, and make informed decisions based on accurate and timely information.
9. What are AI and Machine Learning, and how do they differ?
Let’s begin with the classic definition slide. AI and ML are often misunderstood or even interchanged, causing confusion. Essentially, AI encompasses machine processing that mirrors human cognitive functions such as reasoning and awareness. This can be quite daunting when you really think about it. Take ChatGPT, for example. Through sophisticated algorithms and advanced technologies, it mimics human thinking and behaviour, hence the term artificial intelligence.
What makes AI so potent is its ability to tap into the vast pool of data across the Internet, coupled with immense processing power and sophisticated algorithms. This combination allows it to simulate human thought processes at a basic level, drawing insights from data and offering nuanced responses to queries.
For instance, AI, as demonstrated by ChatGPT, can analyse data to unearth hidden insights, suggest improvements or changes to text, and provide sophisticated answers to questions. There’s a concern, exemplified by Google, that traditional search engines may be replaced by AI-driven question-and-answer systems. AI represents the pinnacle of advanced information processing and analysis.
Now, let’s delve into machine learning, a subset of AI. While it has been around longer than newer AI concepts like ChatGPT, machine learning focuses on analysing vast datasets using distinct algorithms to identify patterns and attributes not readily apparent to human observers.
Machine learning operates on a massive scale, examining relationships and trends in historical data to make forecasts, such as weather and financial predictions. It’s instrumental in basket analysis, where retailers identify products that sell together, leading to strategic product placement in stores.
Clustering is a key aspect of machine learning, revealing groups and patterns that may not be immediately obvious. This enables businesses to capitalise on emerging trends and predict future events.
10. How is machine learning applied in transport for predictive maintenance and sustainability?
In the asset management world where an asset has failed or broken down, we can use that potentially for predicting similar breakdowns in the future, which leads to huge opportunities around improved preventative maintenance and so on.
We’re also using machine learning for forecasting or predicting energy usage or electrical energy usage.
So we’re using all of the metering data and streaming that data in about 10-minute intervals of metre readings. So these are smart meters, which we’re able to bring the data and combine that with a whole lot of operational data as well.
In that platform, we’re bringing in metering, the operational, patronage, weather and a whole host of other data points together. The machine learning model can then start to look for relationships between operational and usage data, to then trend and understand what’s driving that usage.
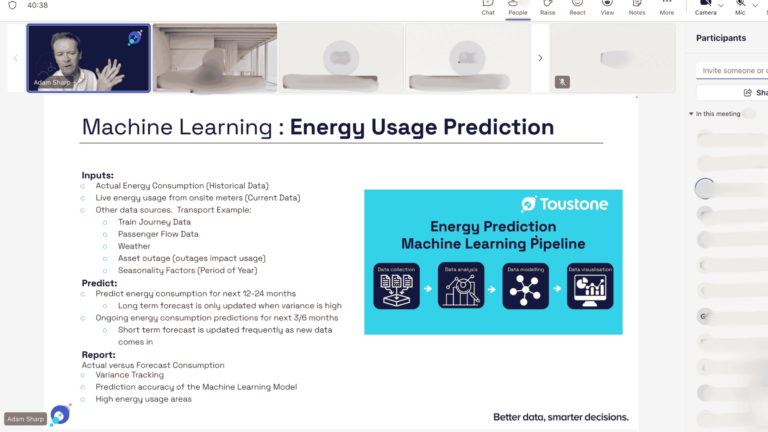
That then allows us to think with great accuracy, and to predict what energy consumption is going to be out into the future, knowing the probability, or schedules of what’s going to occur out into the future as well.
What the model does is that it will then compare its forecast against what the actual results are as we move forward in time, and it will look for where those results start to diverge which may then trigger a retraining process.
So there may have been some things that have occurred recently that have not been seen before. The model will suddenly retrigger itself to retrain based on those new insights. So it’s forever relearning and always keeping itself up to date in terms of the latest information to make sure its forecasting is continually being updated based on the newer information and insights.
That allows us to predict 12 up to 24 months in advance of what energy consumption is going to be with great accuracy.
Then that gets into things like understanding consumption versus our actual prediction and also what’s driving that energy. This allows us to look for opportunities to improve that consumption by reducing what we do with it, so we can also then use that to predict our carbon emissions as well.
So in this day and age of sustainability, that’s becoming very important, not only ethically, but also legislatively and organisations are being held to account in terms of their emissions. So making sure that with great accuracy we can not only predict energy usage, but, using the Australian Government Department of Climate Change and Energy standards, we can then start to enlist what our carbon emissions are based on that energy.
If we have a carbon emissions target that we are obliged to meet, we will know with great accuracy whether or not we’re actually going to exceed, hit or be below it, before we actually get to that point. So if we’re targeted to exceed it, what is it that we need to do to take corrective action to come back in line with our targets?
So that’s a very tangible example of not only using forecasting for understanding and prediction, which allows us to forward buy and potentially save money on the electric electrical forward purchasing market if you like, but also using it around carbon emissions and all of the sustainability obligations that organisations have to do.
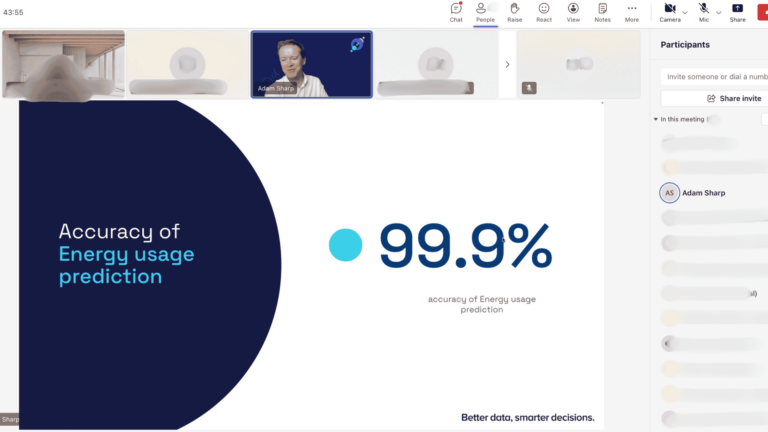
11. What is the accuracy of these sustainability predictions?
We do have metrics where we’ve been able to track the forecast accuracy at a 99.9% accuracy rate. Realistically though, we would say it’s probably around 99.5 to 99.6%, but we are seeing very high levels of accuracy in the model going forward, so we’re pretty pleased with that as well.
12. You touched on using machine learning in the asset management world for improved preventative maintenance, can you explain this further?
The concept of asset predictive maintenance isn’t necessarily new, but here we’re focusing on ingesting detailed asset monitoring log data. This data includes information from vibration sensors, temperature readings, speed measurements, and any other data monitoring your assets.
By ingesting all of this data, including instances where assets have failed, we can retrospectively examine the logging data to identify patterns that could serve as leading indicators of eventual failure. As the model analyses this data and undergoes training, it can enhance its accuracy in predicting the likelihood of assets failing in the future based on similar traits observed in the logging data.
Even if an asset hasn’t failed yet, if it’s exhibiting similar behaviours, this triggers automated alerts about the risk of asset failure. Subsequently, this enables clear decision-making regarding preventative maintenance and prioritisation of maintenance for assets that are becoming vulnerable to failure. This scenario illustrates a very practical application of machine learning.”
13. How does real-time transport data enhance machine learning algorithms?
Real-time transport data significantly enhances machine learning algorithms by enabling more accurate and timely analysis of service disruptions. For instance, when analysing live data from transport services, machine learning models can continuously monitor for deviations from normal operations. If a disruption is detected, these models can quickly assess its impact and predict the likelihood of ongoing issues.
This involves deploying an algorithm or model designed to identify service disruptions and subsequent headway issues.
It aids transport operators in intervening effectively by rescheduling services to minimise ongoing headway problems across subsequent stations. We address primary disruptions and subsequent secondary disruptions, adjusting services if needed to mitigate ongoing disruptions.
For example, if a service experiences a short headway followed by a longer one, machine learning can help determine whether to slightly delay the next service to better align the headways.
This approach leverages machine learning to reduce the impact on passengers and enhance customer service and outcomes in real-time, enabling the transport operator to capitalise on or identify issues and risks and respond before they escalate into major problems.
So again, machine learning offers sophisticated opportunities to analyse the data we’ve collected and processed, providing highly accurate insights and forecasts that allow us to take proactive measures before issues arise.
14. What are some other emerging data technologies that you are using to gain further organisational insights?
One notable example is the digital twin concept. Essentially, it involves virtualising real-world scenarios into a 3D landscape and incorporating various insights into this virtual environment. This provides contextual information within the landscape.
The digital twin renders the landscape authentically, allowing users to navigate through it and locate specific assets. This enables us to overlay relevant asset information based on user interest. Since it’s a virtual environment, we’re not limited to walkways; we can explore above and below ground, accessing restricted areas and tunnels. This immersive experience facilitates a deeper understanding of asset information.
We’re exploring this concept to enhance awareness of asset information, making it useful for various use cases, including training and emergency services. This approach transforms data into actionable insights, improving decision-making efficiency.
In essence, it involves transforming a 3D CAD plan into an interactive landscape, which could potentially be accessed through mobile devices, akin to Google Maps or Google Street View.